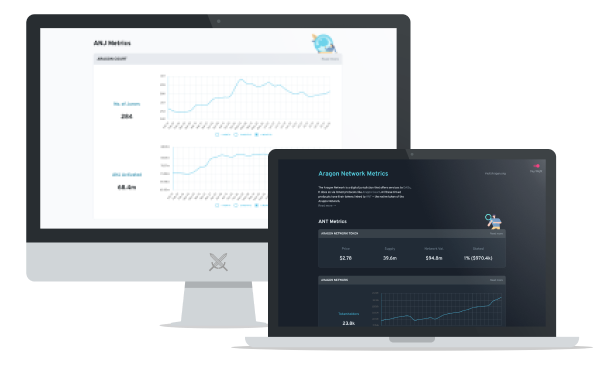
Aragon Metrics Dashboard
The Aragon Network is a digital jurisdiction that offers services to DAOs. It does so via linked protocols like Aragon Court with ANJ. All these linked protocols have their tokens linked to ANT — the native token of the Aragon Network. The Metrics Dashboard is a project for providing insight to data regarding the ANT and ANJ tokens.
The Challenge
The initial challenege was deciding what information we wanted to visualize and how to best visualize it. Once that was decided, we realized that a majority of the visualizations would be time series charts. While it’s relatively simple to receive the current state of the blockchain with a single query, it’d take many tens of queries to get time series data with JSON-RPC, it quickly became obvious that we needed a caching solution to make this viable.
Raiders

Darren
Design
Saimano
Front-End Dev
ukstv
Graph Back-End Dev
proofoftom
Project LeadOur Approach
With a clear set separation of concerns (design, frontend, and subgraph), each raider was able to mainly focus solely on their specialty, allowing for quick and concurrent development. Once the design was implemented, the subgraph was ready and there was exceptional cooperation to get the subgraph data into the frontend charts - like fitting two pieces of a puzzle together. We then went through an extensive QA to smooth out any rough edges.
 Our Solution
On the tech side, we replaced raw contract calls by building a custom subgraph which enhanced both experiences of the developers maintaining the data, and users fetching the data.
On the design side, we were able to make the charts especially easy on the eyes while providing useful, readable information.